Manager

Use your own secure MapProvision manager web application to upload your data and compose how your viewer portal will be displayed to your users.

Choose from the available layers.
Change the symbology of your layers.
Upload your gis data files.
Import your Android My Tracks data.
Update your datasets.
Create your own custom image layers.
Organize layers into folders and arrange their layout in your layer tree.
Configure how the map will be displayed.
Publish the viewer portal to your website.

>> Learn More...


Viewer

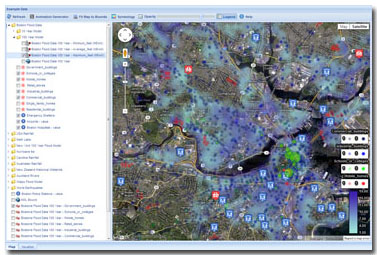
Embed the MapProvision viewer in your website, blog or intranet to display your geo data to your users.

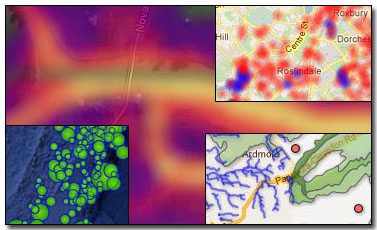
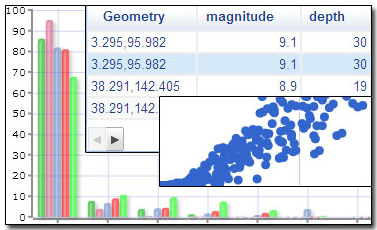
Empower your website visitors to browse and navigate your data, do custom analysis, animation, and charting

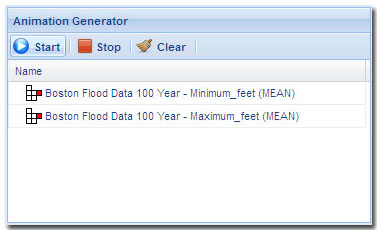
Use the animation generator to perform custom animation.
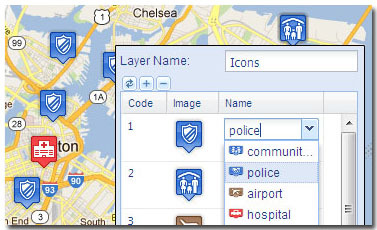
Tools to easily navigate your data.
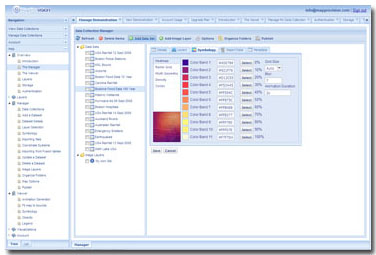
Adjust layer symbology on the fly.
Adjust the opacity of individual layers.
Dynamic legend to show the range of data currently being viewed.
Data is available in real time.

>> Learn More...

Image sets

The Image Layer tool allows you to represent your data on the map using your own images.

Upload your own images to use as markers on your map.
Create yours own image sets to represent your data.
Use the images that you upload across multiple Image Layers.
Create your own custom image layers.
Supports JPEG, PNG and GIF formats.

>> Learn More...


Overlays

MapProvision offers a a number of different overlay types that you can specify to represent your data.

The following overlay types are currently supported.

Sankey Map.
Images and icons.
Interpolation.
Raster Grid.
Density.
Circles.

KML Multi Geometry.
>> Learn More...

Animation

MapProvision supports animation between different interpolation and raster grid layers.

Drag your layers into the animation generator.
Start and stop your animation.
Adjust the animation duration.
Animations are created on the fly.
>> Learn More...


Charting

MapProvision allows your users to perform charting for analysis and comparison against your datasets.

Charting can be performed against the entire dataset or just the data present in the current map portal.

The following charting and visualization tolls are available.

Histogram.
Scatter Plot.
Table.
Metadata.

>> Learn More...

Site Design & Content © 2011 MapProvision
All registered trademarks belong to their respective owners.
MapProvision