Viewer
The MapProvision Viewer is a web application that you can embed directly into your webpage, blog or
Intranet. Or alternatively you can view it as a stand alone Webpage.
It will represent one of your data collections. You can have as many different data collection as you want.
A Data Collection is a set of Datasets that you have added to the Data Collection. The viewer will show the Datasets you have
added in the way that you have configured them to display in the MapProvision Manager. This includes the layer
types, names, folder groupings and map display options that you have specified.
The viewer can be used to display the layers on the map by clicking the layer's checkbox. Similarly the
layer can be turned off by deselecting the layer's check box.
The viewer has two main tabs, located at the bottom of the Viewer for displaying the data these are:
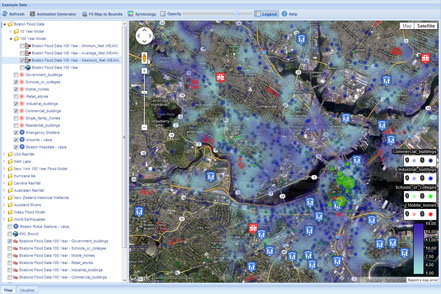
Map
The Map view allows the data to be viewed spatially on the Map.
It has a number of tools to enhance the viewing of the data in the map:
 Refresh: Refreshes the data tree to load any recently added layers. Refresh: Refreshes the data tree to load any recently added layers. Animation Generator: Launches the Animation Generator to create animations between two layers. Animation Generator: Launches the Animation Generator to create animations between two layers. Fit Map to Bounds: Auto positions the map to show all the selected layer's data. Fit Map to Bounds: Auto positions the map to show all the selected layer's data. Symbology: Launches a window that allows you to change the layers symbology. Symbology: Launches a window that allows you to change the layers symbology. Opacity: A slider tool that can be used to dynamically change the opacity of the selected layer. Opacity: A slider tool that can be used to dynamically change the opacity of the selected layer. Legend: A toggle button to turn the current legend on and off. Legend: A toggle button to turn the current legend on and off.
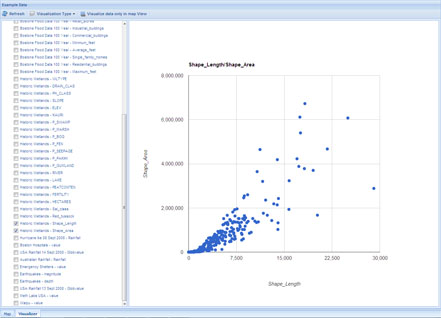
Visualizer
The Visualizer allows the data to be viewed as visualizations such as Histogram, Scatter Plot and Data Tables.
- Refresh: Refreshes the data tree to load any recently added layers.
 Visualizer Type: Used to select the current visualization between Histogram, Scatter Plot, Data Table and Metadata display. Visualizer Type: Used to select the current visualization between Histogram, Scatter Plot, Data Table and Metadata display.- Visualizer data only in Map View: Toggle button that when toggled will only visualize data in the Map View's current view.
|