Scatter Plot
In the MapProvision Viewer Visualization tool you can select Scatter Plot from the Visualization drop
down menu. Selecting this will show the dataset attributes that you select in the tree as
scatter plot visualizations.
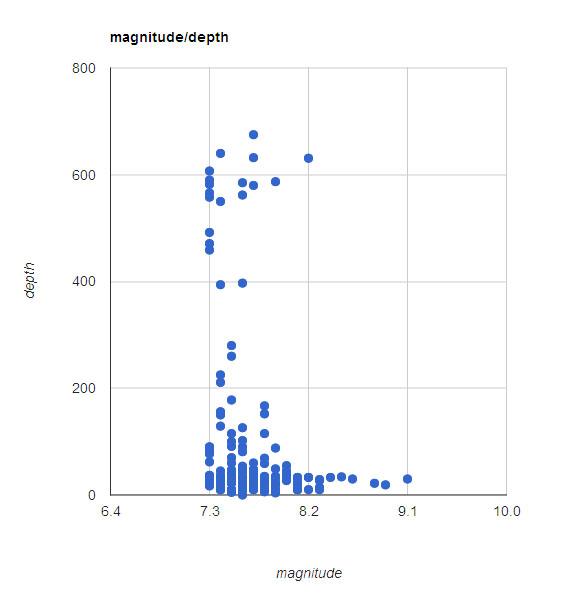
You must select two dataset attributes for the scatter plot to display correctly.
The two attributes must be from the same dataset as they are being compared against each other
based on each point having the exact same point, line string, or polygon.
|