Sankey Map
Overview
 |
 Sankey Map Sankey Map
Sankey diagrams are a type of flow diagram where the width of the arrows are proportional to the volume being
described. MapProvision now offers the ability to create Sankey Maps overlaid on top of a map to show data flows
between geographic locations. This new visualization provides an easy way to understand data flows and volumes within
a geographic context.
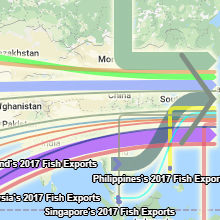
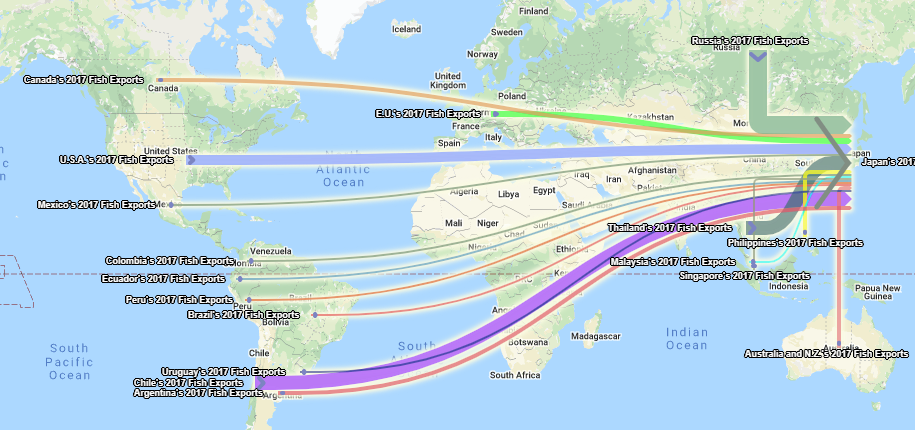
The following example shows Fish Imports into Japan. The width of each path is proportional to the volume of
imports between the two exporting countries.
|
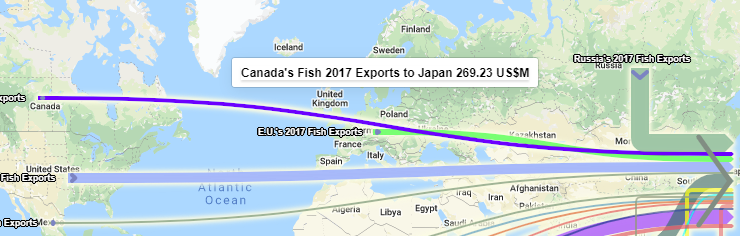
Users can mouse over the generated Sankey paths and start/end points to see the underlying metrics that were
used to generate the data layer on the map.
Hovering the mouse over a given path will show a tool tip displaying the underlying metric displaying the
size of the import from that country.
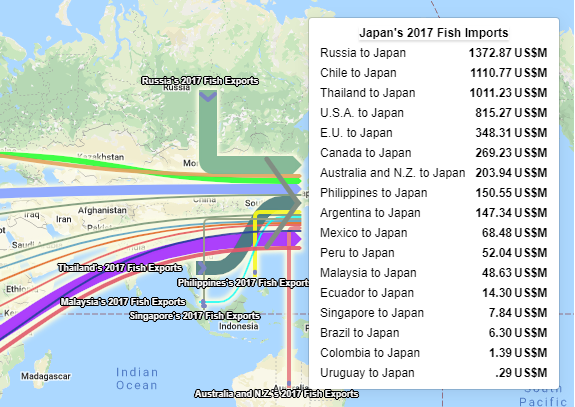
Hovering the mouse over a given start or end arrow at a node will show a tool tip displaying all the
underlying metrics from or to that node. Doing this will also make all other node’s paths transparent
so that the selected data is more prominent.
You can display multiple Sankey layers on the map at the same time and adjust the opacity of each layer on the fly.
To do this you click the selected layer in the layer tree and use the opacity slider tool to drag the opacity up and down.
Symbolgy
The Sankey Map symbology can be be altered either:
- In the Viewer when viewing the layer where the symbology changes will stay in effect only until the
layer tree is reloaded.
- In the Manager when adding or updating the dataset. These changes will stay in effect indefinitely until the symbology is
again updated.
In the Viewer you can temporarily change the Sankey Map layer symbology in the Viewer by right clicking the layer in the layer tree
and selecting symbology from the menu.
Or you can click the Symbology button while the layer is selected in the layer tree. Selection in the layer tree means the
item in the tree has been clicked and is highlighted it does not mean that the item has its checkbox ticked.

In the Manager you can change the layer's symbology by editing it's symbology panel
in the Symbology tab. These changes will stay in effect until the symbology is again updated
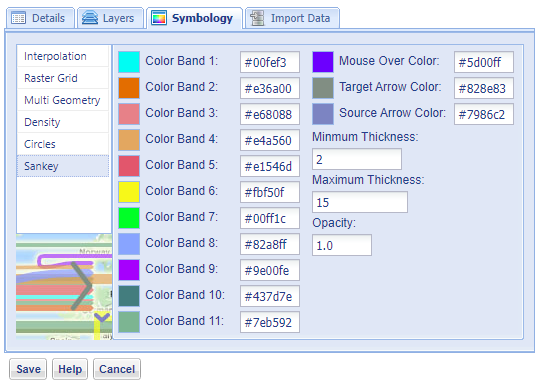
Color Bands
You can change the colors used to represent each path that is used to render the Sankey Map layer.
You can also select the color the path displays as ahen selected and the color of the source and target
arrows, as well as the path thickness and opacity.
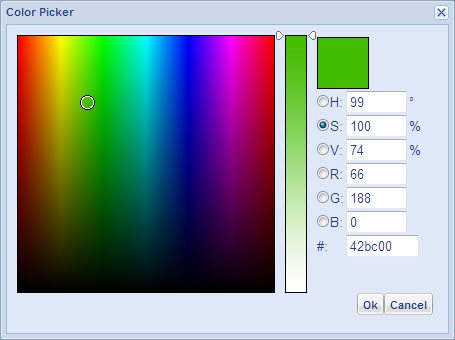
You can click the select button to popup a color picker (shown below) to help choose your desired color.
Uploading Sankey Map data sets
You will need to prepare your data file for upload. The Sankey data file format is different to the file format
expected for other MapProvision layers as each data record requires a start and end point and the ability to craft
custom descriptions for the tool tips when the user is interacting with the Sankey Maps.
The basic Sankey data format is a Comma Separated Values (.csv) file shown in the format below. There is a source
place name and a target place name and a value for the Sankey Path.
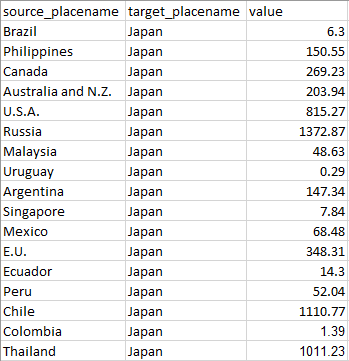
You can download the file used in this example by clicking here.
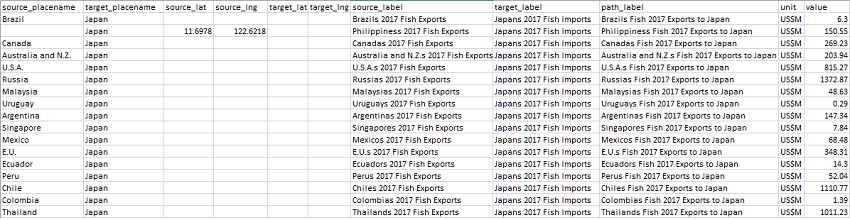
To display more information in the Sankey Map there are optional extra columns to add detailed descriptions to the
Sankey Map when the user hovers over a Sankey Path or Start/End Point arrow.
The following example shows an example Sankey data format is a Comma Separated Values (.csv) file with detailed
descriptions and units of measure added.
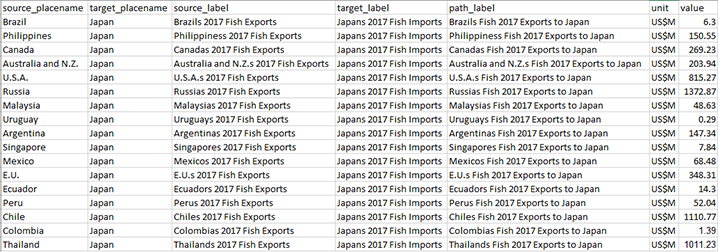
You can download the file used in this example by clicking here.
The Sankey Map uploader has a large number of place names such as countries and cities that it can recognise
and create the known coordinate for you automatically on the map. Often you will want to use your own coordinates
instead of a place name so you can chart data to and from places that are more arbitrary and not recognised automatically
by the uploader. To use your own coordinates to specify source and target Sankey locations the following field names are
supported in your CSV file:
- source_lat
- source_lng
- target_lat
- target_lng
These can be used alongside plain English source and target names which are recognised by the application so that you
have a balance between the convenience of automatic coordinate lookup for known places along with the ability to specify
your own specific source and target locations.
The following example shows an example Sankey data format is a Comma Separated Values (.csv) where a mix of plain English
place names are used along with specific coordinates specified:
You can download the file used in this example by clicking here.
Further Info
For a full walk through showing how to easily create your own Sankey Maps this Blog Article takes you through the process.
|