Map Options
To launch the Map Options tool click the Options button in your Data Collection's Manager mode.

This tool allows you to configure how the Map will be displayed in your Data Collection's
Viewer portal.
On the right is a Map that will show how the Map will appear and can also be used to change the default zoom level and center position.
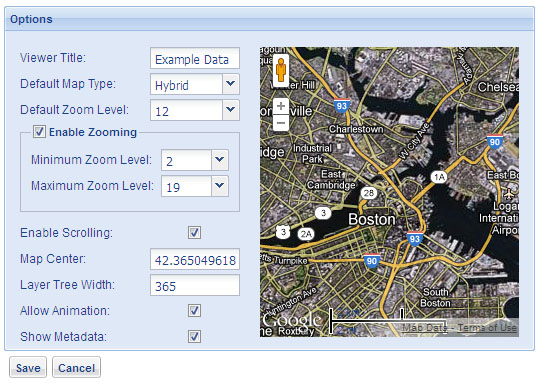
It allows the following settings to be modified:
Viewer Title
You can change the title that will be used on the header for the Data Collection's Viewer
portal. This can be used to give the Data Collection's Viewer a unique name.
Default Map Type
You can set the default Map type that will be used for the Data Collection's Viewer. The typical
Google Map layers are available: Roadmap, Satellite, Hybrid and Terrain.
Default Zoom Level
You can set the default zoom layer that the Map will use when Data Collection's Viewer is loaded. You can change the
value either on the map or by using the drop down box. Google Maps supports the zoom levels 0 through to
19. With 0 being the highest and 19 being the lowest.
Enable Zooming
You can either disable or enable whether the user can use zooming in the viewer. If zooming is enabled
the following two options are available.
Minimum Zoom Level
You can set the minimum zoom level allowed in the Data Collection's Viewer
portal.
Maximum Zoom Level
You can set the maximum zoom level allowed in the Data Collection's Viewer
portal.
Enable Scrolling
You can set whether the user is permitted to scroll the map in the Data Collection's Viewer
portal. Disabling scrolling means the maps position will be static and will not be allowed to scroll
to new position.
Map Center
You can set the default map center position in the Data Collection's Viewer portal. This can either be set
by typing a (lat,long) position into the text box or by scrolling the map to a new
position.
Layer Tree Width
Setting the Layer tree width will set the amount of pixels to be used as the default width of the
layer tree in the Data Collection's Viewer portal. Depending on the length of your layer names
you may want to increase or decrease the default layer tree width to allow more room to be available to
display the map. In the Viewer the user can drag the border separating the layer tree and the map to a desired
position. But setting the tree width here will change the default position.
Allow Animation
You can select whether you want the animation Generator to be available in the Data Collection's Viewer
portal. If you do not have any interpolation or raster grid layers you may not want to enable the
animation generator as you may not have any layers compatible with it.
Show Metadata
This allows you set set whether you want the dataset's metadata to be available in the
Data Collection's Viewer Visualization portal.
Metadata information will still be available to the account owner in Manage mode when selecting
existing datasets for update.
Saving
Once you are happy with the changes you can select save and the changes will now dictate how the map is
displayed in the Viewer. If the Data Collection's Viewer is already loaded you will need to reload the
Manager or launch the Viewer to see the new changes take effect.
|