Legend
In the Viewer can can use to toggle the legend on and off in the Map.

The default is on and clicking the Legend button will make the legends disappear. Clicking again will
display them again.
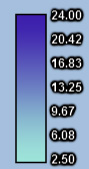
The Interpolation and Raster Grid layers have the following type of legend. The legend will be based on the
minimum and maximum values that are shown in the map for the last selected layer. The legend is readjusted
every time the legend is displayed or the map is moved so that only values shown in the map's bounds
will be used to calculate the color range and associated legend.
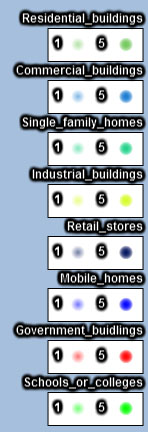
Each density layer displayed on the map will have their own density legend.
This legend shows the what the color and size of one and five occurrences of a density plot looks
like on the map.
|