Circles
 |
 Circles Circles
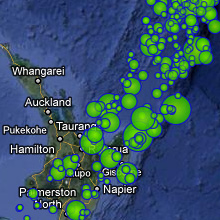
The Circles layer represents the dataset's values as circles. You can set the maximum and minimum radius
in the symbology settings. Every time the Circle layer is displayed the minimum and maximum
values are calculated based on all the data that is present in the displayed map. The circles are then assigned
a radius between these two values that is representative of the data points value.
The circles are represented using a circular gradient between two colors an outer and inner color. The color values can be set
to represent the Circle layer in the symbology settings.
You can also specify the opacity and an optional circle outline's stroke color, stroke width and stroke opacity
in the symbology settings.
|
Symbolgy
If color values are not explicitly set and multiple Circle layers are activated then different color values
will be assigned.
The Circle symbology can be be altered either:
- In the Viewer when viewing the layer where the symbology changes will stay in effect only until the
layer tree is reloaded.
- In the Manager when adding or updating the dataset. These changes will stay in effect until the symbology is
again updated.
In the Viewer you can temporarily change the Circle layer symbology in the Viewer by right clicking the layer in
the layer tree and selecting symbology from the menu.
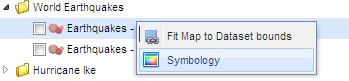
Or you can click the Symbology button while the layer is selected in the layer tree. Selection in the layer tree means the
item in the tree has been clicked and is highlighted it does not mean that the item has its checkbox ticked.

In the Manager you can change the layer's symbology by editing it's symbology panel
in the Symbology tab. These changes will stay in effect indefinitely until the symbology is again updated
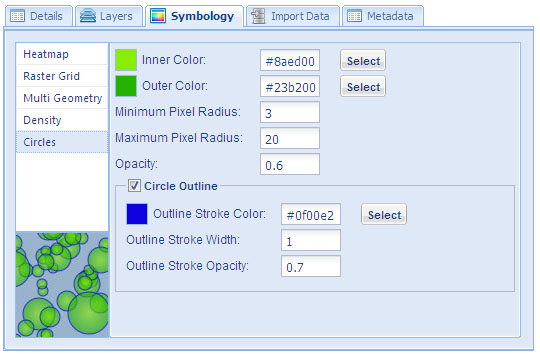
You can set both the inner and outer color to represent the circle layer. If you do not want a color gradient in
the circle you can set both colors to the same value and no gradient will be used.
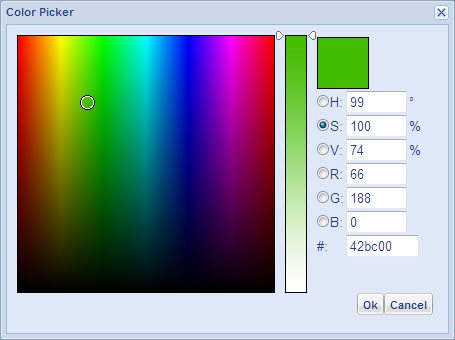
You can click the select button to popup a color picker (shown below) to help choose your desired color.
You can specify the minimum and maximum pixel radius of the circle layer. The values that are being displayed
on the Map's bounding box will use these minimum and maximum values to size the circles based on the
individual plot values. You can also invert the maximum and minimum values so that the minimum radius is
greater than the maximum radius which will cause plots with higher values to be smaller circles.
You can set the base opacity for the circle layer to make the circles more transparent.
You can either specify an outline or no outline by clicking the Circle Outline checkbox. If this checkbox is selected
the symbology options for the outline will be shown. Here you can set the stroke width, opacity and color for the
circle outline.
Circle Value
When the legend is toggled into off mode using the 'Legend' button on the tool bar you can interogate information about
the circle point by either:
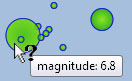
Hovering the mouse over any of the displayed circles the inner and outer colors are inverted and the circle's
value is shown as a hint on the map.
Clicking on any circle to show a pop up window displaying all the attributes defined for the
circle's data record. This feature is only be available when the legend is toggled into off mode
using the 'Legend' button.
|